Bankrate Mortgage Calculator Estimates vs. Your Real Payment
Run the same $400,000 house through the Bankrate mortgage calculator, the Zillow mortgage calculator, NerdWallet's, and your lender's website, and you can get four monthly payments that differ by $600 or more. Nobody's formula is broken. The amortization math behind every one of those tools is identical, down to the penny. What differs — quietly, in fields most people never open — is the set of default assumptions each tool makes about property taxes, insurance, PMI, and your interest rate. Those defaults are where estimates go wrong, and they're what this page is built to expose.
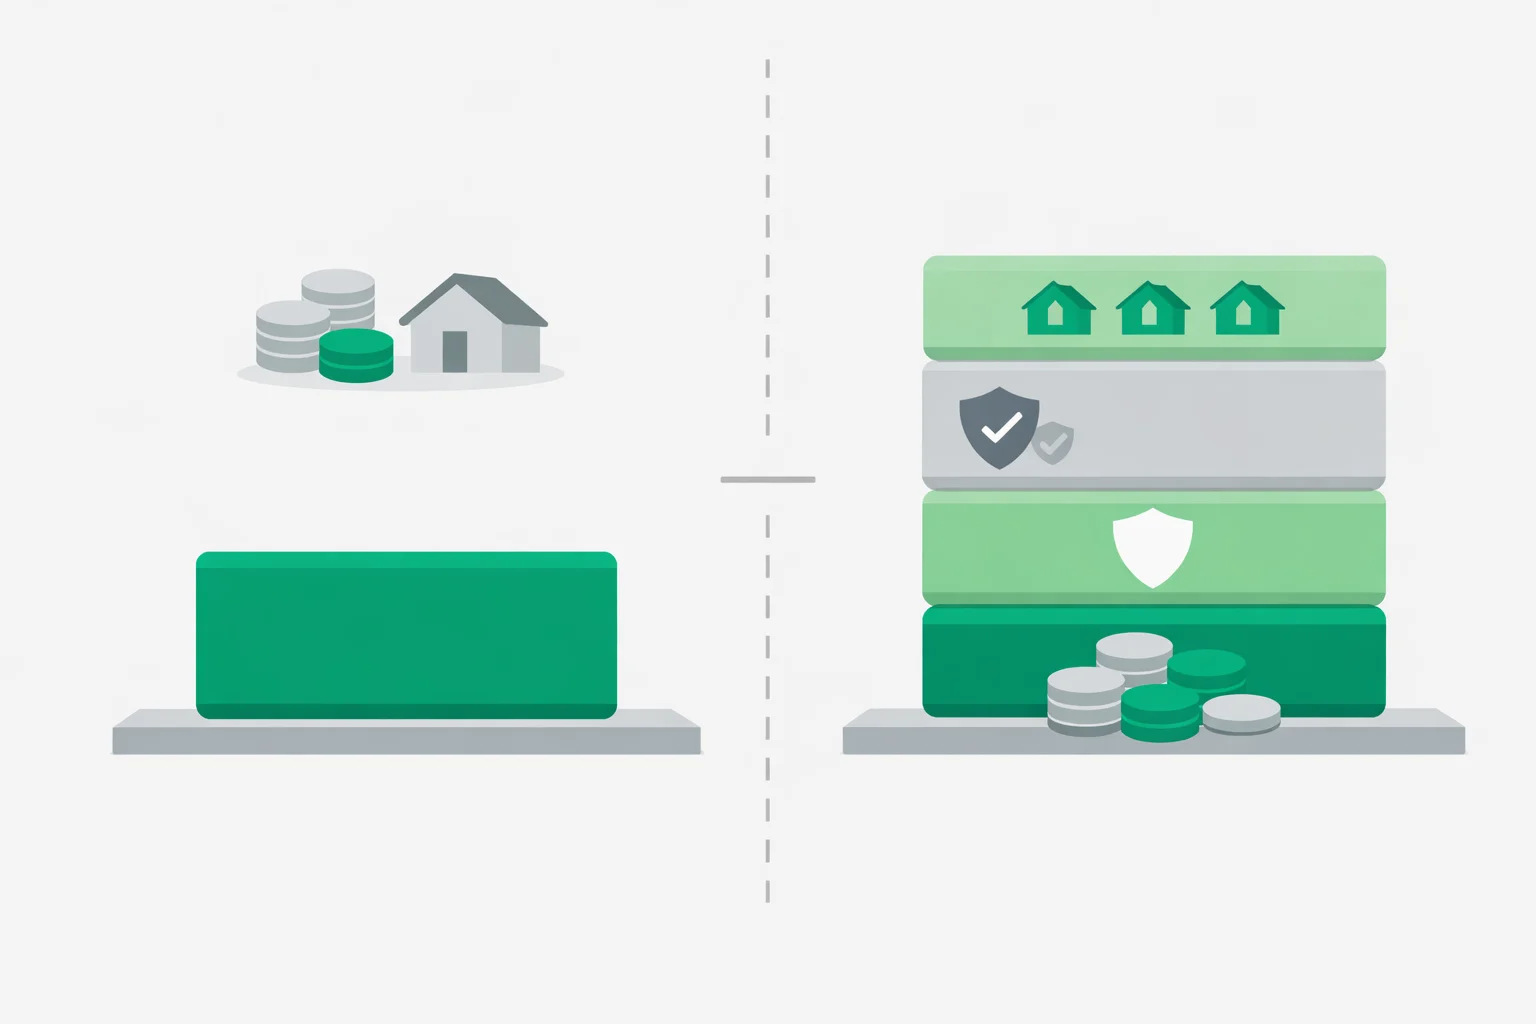
Same House, Same Rate, Four Different Payments
Every mortgage calculator computes principal and interest with the same standard formula: M = P × [r(1+r)ⁿ] ÷ [(1+r)ⁿ − 1], where P is the loan amount, r is the monthly rate, and n is the number of payments. On a $360,000 loan at 6.5% over 30 years, that's $2,275.44 — on Bankrate, on Zillow, on our mortgage calculator, on a spreadsheet. There is no "more accurate" version of this math.
The disagreement starts one layer up. One tool pre-fills property tax at 1.2% of the home price. Another pulls a ZIP-code average. A third leaves it at zero unless you expand an "advanced" panel. Same story for insurance ($1,200/year default here, $2,500 there) and PMI (included on one, silently absent on another). Stack three or four of those small differences and two perfectly correct calculators land $600 apart on the same house.
The Default Assumptions Audit
Here's what the popular quick calculators tend to assume, what reality looks like, and what the difference does to the monthly payment on a $400,000 home with 10% down:
| Input | Typical Default | Realistic Range | Monthly Swing |
|---|---|---|---|
| Property tax | ~1.2% flat national figure | 0.32% (HI) to 2.23% (NJ) | $107 – $743 |
| Home insurance | $1,200–$1,500/yr | $1,200 – $5,500+/yr (FL, LA coast) | $100 – $460 |
| PMI | Often omitted entirely | 0.3% – 1.5% of loan/yr under 20% down | $90 – $450 |
| Interest rate | National average (740+ score assumed) | Your quote: 0.25% – 0.75% higher is common | $60 – $180 |
| HOA dues | Blank | $0 – $400+/mo (condos often more) | $0 – $400+ |
Read the right-hand column again. Worst case, the defaults hide over $1,500 a month. A more typical miss is $400–$700 — still enough to turn an "affordable" house into a budget problem at the closing table.
The $732 Gap: P&I vs. What You'll Actually Pay
Walk through one complete example. You're buying a $400,000 house with $40,000 down (10%), financing $360,000 at 6.5% for 30 years:
- Principal & interest: $360,000 at 6.5% over 360 payments = $2,275/month. This is the number most quick estimates lead with.
- Property tax: at a 1.1% effective rate, $400,000 × 1.1% = $4,400/year = $367/month into escrow.
- Homeowners insurance: $2,400/year, near the national average = $200/month.
- PMI: 10% down means private mortgage insurance. At 0.55%, $360,000 × 0.55% = $1,980/year = $165/month.
Real payment: $3,007. The P&I-only figure understates it by $732 a month — about 24%. Over the first five years, that's roughly $44,000 of housing cost a bare-bones estimate never showed you. The calculator above prints this gap in the amber panel on every calculation, because in our experience it's the single number that changes how people shop.
Which Property Tax Number Should You Enter?
Property tax is the biggest wildcard, and a flat national default handles it worst. Effective rates run from 0.32% in Hawaii to 2.23% in New Jersey — a 7x spread. On a $400,000 home that's $107/month versus $743/month for the identical house. A calculator that quietly assumes 1.2% will overshoot Denver by about $200 a month and undershoot Newark by roughly $340.
Three reliable places to find your real number, in order of accuracy: the seller's most recent tax bill (usually in the listing's tax history), your county assessor's published rate, or our property tax calculator for state-by-state effective rates. One warning that catches buyers of new construction: the current bill may reflect the empty lot, not the finished home. Budget off the assessed value the county will assign after completion, or your escrow payment can jump $300+ in year two.
PMI: The Line Item Quick Calculators Skip
Put down less than 20% on a conventional loan and you'll pay private mortgage insurance — typically 0.3% to 1.5% of the loan amount per year depending on your credit score and down payment. Plenty of payment estimators just leave it out.
It's not a small omission. On our $360,000 example at 0.55%, PMI adds $165 a month. Under the Homeowners Protection Act it terminates automatically once the balance amortizes to 78% of the original home value — month 109 in this scenario, a little past year 9 — which means about $17,900 in total premiums if you never intervene. You can request cancellation earlier at 80% loan-to-value, and prepayments or a post-appreciation appraisal can pull that date forward by years. The schedule in the calculator marks exactly which years still carry PMI; for removal strategies by credit tier, our mortgage calculator with PMI goes deeper.
Here's Where Rate Assumptions Trip You Up
Big calculator sites pre-fill the interest rate from a national survey average, and survey averages describe a specific borrower: roughly a 740+ credit score, 20% down, often with discount points baked in. Freddie Mac's weekly Primary Mortgage Market Survey is the usual source. If your score is 680 and you're putting 10% down, your real quote can easily sit 0.5% above that pre-filled number.
Half a percent sounds minor. It isn't: on $360,000, moving from 6.5% to 7.0% raises the P&I payment from $2,275 to $2,395 — $120 a month, about $43,000 over the full term. That single hidden assumption can outweigh every other default on the page. Until you have a written quote, run your numbers at the advertised rate and at +0.5% and make sure the budget survives both.
When a Quick Estimate Is Good Enough
A P&I-only estimate isn't useless — it's just a tool for a different job. It's fine when you're comparing two loan structures against each other (15 vs. 30 year, 6.25% vs. 6.75%), because the omitted costs are identical on both sides and cancel out. It's fine for a first pass at "is this price range even plausible?"
It fails the moment the output feeds a real decision. Setting your maximum offer, comparing a mortgage against your current rent, or checking a payment against the 28% front-end ratio a lender will apply — those all need the full PITI + PMI + HOA figure. Using a $2,275 estimate to make a $3,007 commitment is how buyers end up house-poor in year one, and it's the most common miss we see when people cross-check estimates against our mortgage calculator with taxes and insurance.
Verify Any Mortgage Calculator in Three Minutes
You don't have to trust any tool's defaults — ours included. Three lookups turn a generic estimate into a personal one:
- Tax rate (1 minute):divide the seller's last annual tax bill by the asking price. A $6,200 bill on a $400,000 listing = 1.55%. Enter that, not the default.
- Insurance (1 minute): until you have a real quote, use $6 per $1,000 of home value per year as a national baseline — $2,400 on $400,000 — and double it in hurricane or wildfire territory.
- PMI (1 minute):if you're under 20% down, multiply the loan amount by 0.55% and divide by 12 for a mid-range figure. Skip this only for VA loans, which charge an upfront funding fee instead of monthly insurance.
Then compare your result against the official numbers when they arrive. Within three business days of applying, your lender must send a standardized Loan Estimate with the actual projected payment, escrow, and mortgage insurance. If page one of that document differs from your calculator run by more than about 5%, one of your assumptions — usually the tax rate — needs fixing before you shop any further. That cross-check, not brand loyalty to any calculator, is what keeps your budget honest.